How Neighborhood Markets Affect Vacancy
IN THIS SECTION
Systemic property vacancy results from a fundamental imbalance between housing supply and demand. You can’t solve “blight” without addressing this imbalance—which is fundamentally about the strength of your local real estate market. To craft an effective strategy to address vacant and abandoned properties at scale, community leaders must understand how real estate markets work.
A Note on Distinguishing City-wide vs. Neighborhood Markets: City-wide economic indicators like median wealth and average housing cost can mask vastly different realities at the neighborhood level. A thriving city center can coexist with blocks of disinvested properties just miles away—even in very small cities. Housing and market conditions can vary significantly from block to block. To be most effective, local leaders must tailor neighborhood revitalization efforts based on those small-area differences.
Housing Markets and Vacancy
Neighborhood vitality can be measured by many factors: housing quality, safety, schools, natural environment, and the strength of community ties. But perhaps the most consequential factor is whether individuals choose to settle in one neighborhood over another, given their available means.
The more people want to move into a particular neighborhood, the stronger its real estate market becomes, often measured by rising property values. This changes how homeowners—both owner-occupants and absentee owners or landlords—behave. Property owners will invest in upkeep, developers will build and rehabilitate homes, and tax delinquencies and foreclosures will decline. An improving or stable neighborhood incentivizes residents to stay, which deepens the community bonds that make a neighborhood resilient. (But there’s an important caveat: A market that becomes too competitive can, if unchecked, put pressure on affordability and displace the very residents whose presence gave the neighborhood its character.)
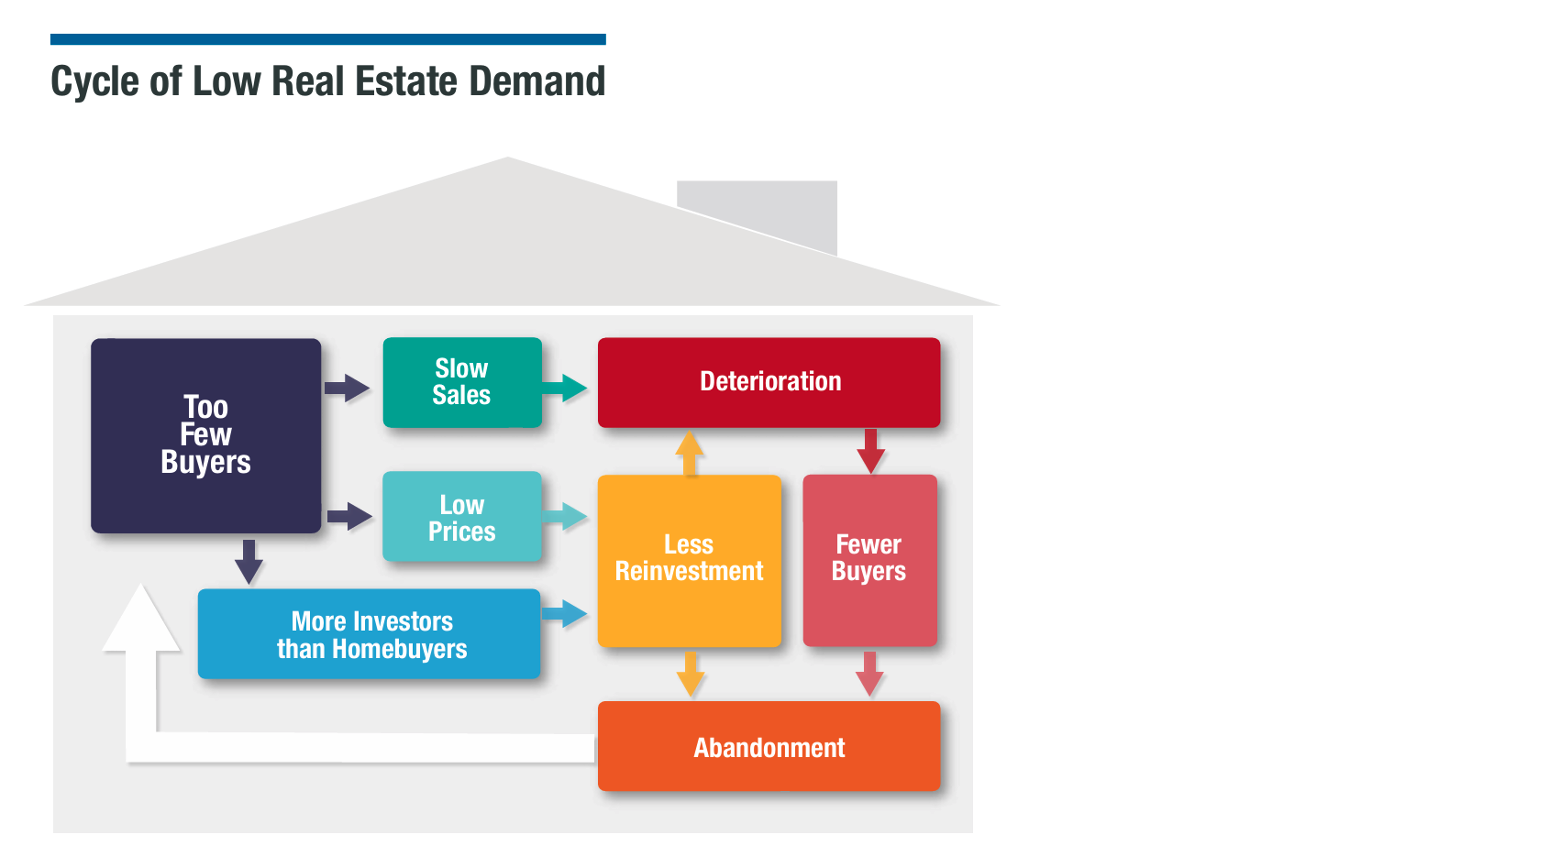
The opposite comes to pass when fewer people choose a neighborhood. Prospective residents may perceive—often without setting foot in it—that a neighborhood has failing schools, high crime, poor access to amenities, or simply a sense of “going downhill.” They choose to live elsewhere, if they have the means. Meanwhile, seeing their property values stagnate or decline, homeowners and landlords may defer maintenance if they can’t recoup the cost in a sale or higher rent, or walk away from a property entirely. Tax delinquencies and foreclosures climb, developers look elsewhere, and longtime residents who can afford to move often do so, while very low-income residents lack this option.
The resulting vacant, abandoned, and deteriorated properties further depress the local economy, which tends to reinforce negative perceptions and perpetuate the cycle. This makes it harder with each passing year for the neighborhood to attract residents and recover.
Neighborhood real estate markets are shaped by internal and external forces
- Internal: Physical, social, and economic changes within the neighborhood
- Desirability of housing stock
- Neighborhood stability
- Amenities and quality of life
- External: Citywide, regional, and global market pressures
- Immigration
- Competing sources of housing supply
- Job and business growth
- Household formation
These forces shift housing demand and price, and other features of the neighborhood follow.
What about non-residential properties?
While a neighborhood’s real estate market also includes commercial, institutional, and industrial properties, residential properties make up the vast majority and largely drive what happens to the rest. Commercial properties in particular, though subject to their own pressures like changing shopping patterns, are most directly influenced by the number of households in the neighborhood and their incomes.
Types of Housing Markets
From a housing market perspective, neighborhoods fall along a continuum—from the strongest, with high demand and high prices, to the weakest, with little demand and depressed prices. Market strength tends to correlate closely with a range of other conditions like tax delinquency rates, vacancy, homeownership rates, the level of owner investment in properties, and the pace of new construction.
While the continuum is in theory endless, most neighborhoods cluster into a manageable number of types. By gathering data on these market indicators, practitioners can create a framework that groups neighborhoods by shared conditions and assigns each type a profile.
The framework below is built around three key indicators:
- Housing demand: Relative balance of buyers seeking homes in a neighborhood against the available supply, as reflected in prices
- Income level of homebuyers: Shapes both who is investing in the neighborhood and the price points the market can sustain
- Physical condition of the housing stock: Degree to which properties are being maintained, reinvested in, or allowed to deteriorate
Housing Market Types
| Market Type | Price Level | Buyer Characteristics | Condition of Housing Stock |
|---|---|---|---|
| Type 6 | High by regional standards |
|
|
| Type 5 | High by city standards |
|
|
| Type 4 | Average or slightly above average by city standards |
|
|
| Type 3 | Average or slightly below average by city standards |
|
|
| Type 2 | Below average by city standards |
|
|
| Type 1 | Substantially below average by city standards |
|
|
Source: Adapted from Alan Mallach, Managing Neighborhood Change (National Housing Institute, 2008), 5.
These factors tend to move together. In Type 5–6 neighborhoods with high housing prices, properties are generally better maintained, vacancy rates are lower, and owner-occupants outnumber absentee buyers; private builders will move quickly to develop infill lots. Historically, most community development corporations (CDCs) have concentrated in Type 1–3 neighborhoods, where weaker market conditions make public or nonprofit intervention critical to the neighborhood’s future.
This framework also indicates which signals to watch. A rising share of absentee buyers in a high-value area, for instance, may be an early warning of decline. An influx of middle- or upper-income buyers into a lower-value area may signal market recovery.
As neighborhoods change, so must the strategies used to support them. A community must know when to shift from market-building—stimulating demand and investment—to protecting affordability and preventing displacement, and be prepared to shift back if conditions change again.
This demands regular reassessment of specific programs. Land banking, for example, works well when demand is weak and land is cheap, but becomes less cost-effective as the market strengthens. Conversely, inclusionary zoning—requiring developers to include affordable units in market-rate projects—may be impractical in a weak market but become feasible and productive once the market is strong.
For more information on how to create a market index or a typology, see Community Progress’ Neighborhoods by Numbers: An Introduction to Finding and Using Small Area Data. For examples of neighborhood market typologies, see our Trenton or Hartford reports.
SERVICES
If you’re struggling with vacant, abandoned, and deteriorated properties in your community, check out our free online resources, webinars, and publications. Local governments should contact the Center for Community Progress at [email protected] for tailored solutions to assess the state of vacancy in your community and recommend policy and practice recommendations that revitalize neighborhoods.
Neighborhood Housing Market Data
A housing market snapshot captures conditions at a single moment, but neighborhoods are constantly shifting—not just in real estate, but in the broader factors that shape demand, like crime, schools, and local economic activity. Tracking these changes over time with neighborhood change indicators allows communities to assess whether their strategies are working and when to change course.
Neighborhood change indicators are data points that measure where a neighborhood stands and where it is heading. They might include:
- home prices
- sales volume
- buyer incomes
- property tax delinquencies
- crime rates
- public health measures (e.g., rates of lead poisoning or asthma)
- new business formation
- civic participation
- property vacancy
- property conditions
Property vacancy and property conditions are particularly important indicators to track. See How to Develop a Vacant Property Strategy to learn more about data resources for these topics.