Topic(s): Parcel Data & Neighborhood Markets
The Housing Recovery: Now You See It, Now You Don’t
January 3, 2014

Originally posted on the National Housing Institute’s Rooflines blog
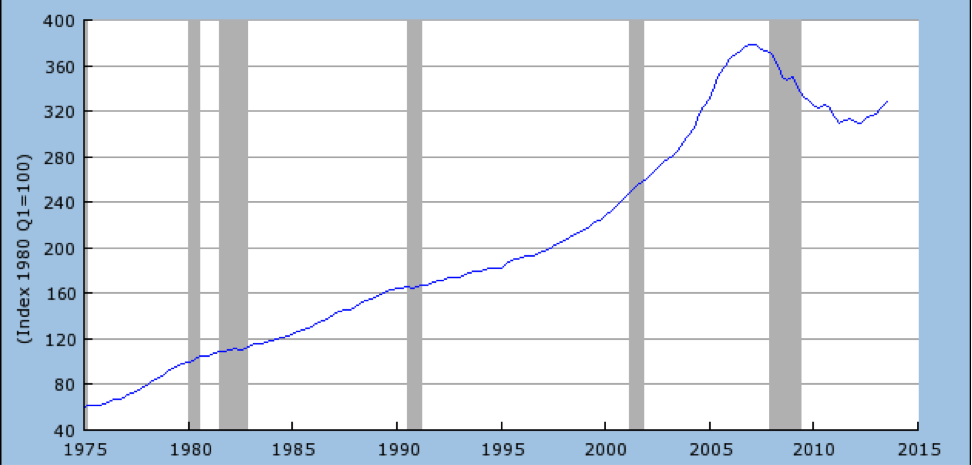
The housing market is coming back. Finally, after listening to false hopes and promises for the last few years, it may really be happening. New construction starts, existing house sales, and house prices have all been inching up steadily for long enough that it can actually be considered a recovery, unlike the blip in 2009-2010, when the new homebuyer tax credit sent sales briefly soaring, only to collapse a few months later. As one can see from the chart below, house prices have now basically gotten back to where they are in line with the long-term trend.
The number of REO properties on the market has dropped from around 2 million in 2011 to fewer than 250,000 across the country today. In many parts of the country, the available inventory of homes for sale has shrunk to the point where—as was true 10 years ago—homebuyers are bidding against each other for properties. Columns and articles warning against a new housing bubble have begun to appear in the business pages of our papers.
This is good news, up to a point.

But there are some major problems lurking behind the statistics.
Prices—not just sales prices, but rents—are being pushed up in ways unrelated to real economic or wage growth by a series of closely related forces. Contrary to what many people expected, as the REO inventory has plummeted, property owners have been in no hurry to put their properties on the market. Some of this has to do with the fact that there are still a lot of underwater borrowers out there, and some, possibly, with the fact that potential sellers are still unsure of the market….or perhaps waiting for it to go higher. While building permits and construction starts are rising, they are still far below historical averages. Even if the recovery continues, it will be years before new construction gets back to historic levels. As pent-up housing demand looks for supply, it’s not there.
All of this is pushing prices up, but yet another factor is pushing rents up. In the last few years, homeownership rates have gone down, and more people are looking for rental housing. Since 2005, the number of renters in the US has gone up by nearly 6 million households, while the number of homeowners has basically stayed flat. Rental vacancy rates have gone down from over 11 percent in 2009 to a little over 8 percent today, and would have gone even lower had it not been for the thousands of investors —from megabucks companies like Blackstone to thousands of ‘mom and pops’—buying houses to rent out. Of course, that increases the competition for the few houses on the market, further pushing prices up.
Not all those renters are there by choice. Many would like to be of the market, less by house prices—which are still fairly affordable in most parts of the homebuyers, but are frozen out country—but by their inability to qualify for a mortgage. Basically, if you do not have a really good credit score today, you will have a tough time getting a mortgage. A little less than half of the households in the US have credit scores under 700. From 1999 to 2007, between 35-40 percent of the fixed-rate mortgages bought by Fannie Mae were for borrowers with scores under 700. Given that many people with really bad credit weren’t in the homebuying market at all, that meant that those borrowers had pretty good access to mortgages. Then it dropped. In the last four years, less than 8 percent of all Fannie Mae mortgages were to borrowers with FICO scores below 700. While FHA is somewhat easier, they’ve become a lot more demanding as wel—from 2007 to 2010 the average FHA credit score went from 635 to 700, and has stayed up there since. Predictably, the number of first-time homebuyers in the market has dropped sharply, as far fewer of them have the high credit scores and net worth lenders are looking for.
All of this has particular impact on urban neighborhoods. Because, in fact, the recovery, for all its limitations, isn’t visible in many urban areas. This is particularly true for the older cities in the northeast and Midwest, and their struggling minority neighborhoods. Cities like Newark, Cleveland and Detroit were hit harder by the housing bubble, fell faster, and have come back slower, than their surrounding affluent suburbs, or not at all. Many inner ring working class suburbs near those cities, like the ones in south Cook County near Chicago or north St. Louis County, Missouri, have fallen even farther behind. This figure shows what’s happened in northern New Jersey, where affluent suburbs like Morris and Somerset have stabilized at about 20 percent below their bubble peak, while Newark, Irvington and Elizabeth are 50-60 percent below the peak, and still dropping.

There are a lot of reasons why these areas were hit so hard when the bubble collapsed, including the extent to which subprime lending targeted communities of color. But one of the main reasons that they are not recovering is because the people who make up their market are largely frozen out of the mortgage market, and as a result, the opportunity to become homeowners. This is one reason why many – perhaps most – cities and CDCs rehabbing houses with NSP dollars found it impossible to sell many of their houses. It wasn’t that they couldn’t find people who wanted to buy, but that those people couldn’t qualify for mortgages.
There are a lot of other reasons why urban areas aren’t sharing in the recovery, but I fear that until we can figure out how to fix the mortgage problem—so people who are sound credit risks by reasonable standards can get mortgages and buy homes—it’s going to be a tough, uphill battle.
Subscribe to join 14,000 community development leaders getting the latest resources from top experts on vacant property revitalization.
