Topic(s): Delinquent Tax Enforcement
Where the brave dare not go
November 2, 2016


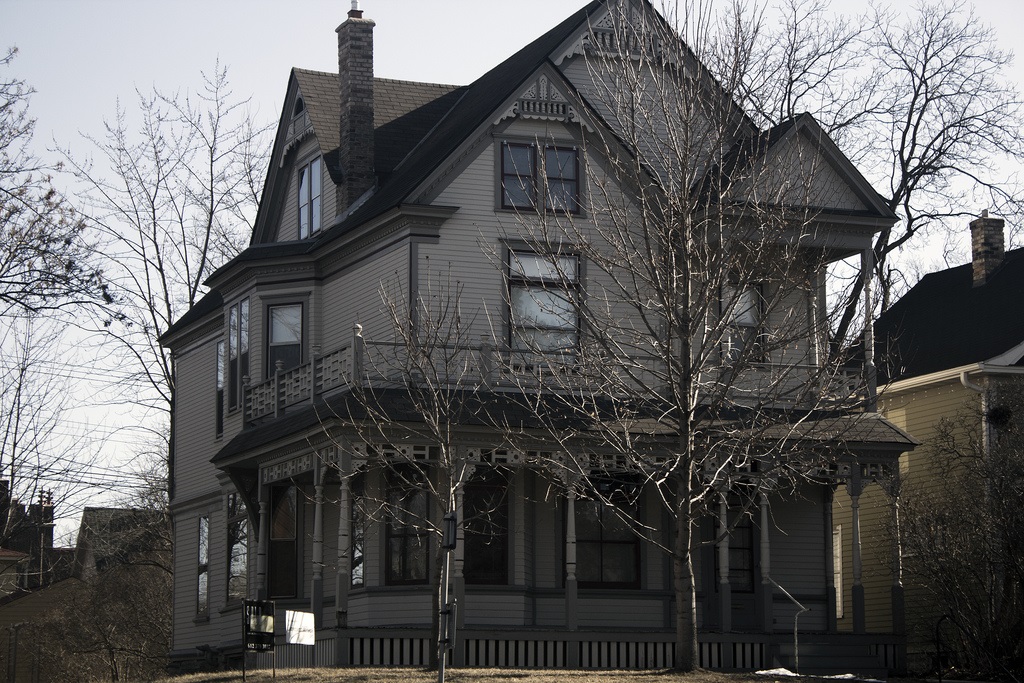
Minneapolis, MN Home by Flickr User, Bear
Few topics will kill a conversation faster than inviting a discussion of property taxes. At the same time, however, the efficiency and effectiveness of our local governments and school districts tends to be a favorite topic of discussion. The problem – and challenge – is that these two topics are intricately related.
On a national level the property tax is the single most important source of locally controlled revenues for local governments and school districts. It is also one of the least understood and most complex forms of taxation.
Few venture into this thicket where the brave dare not go. The exception to this is the work done by the Lincoln Institute of Land Policy and the Minnesota Center for Fiscal Excellence in their annual 50-STATE PROPERTY TAX COMPARISON STUDY. For over twenty years this national study has presented a comparison of the property tax rates in the largest cities in each of the fifty states, and in more recent years has included comparative tax rates in rural cities in each of the states.
The importance of this work lies in its careful analytics and sophisticated appreciation of the key underlying variables. It does not focus just on millage rates, or even assessment ratios. Its goal is to derive and present comparative effective property rates (total tax divided by total value) across four property types (owner-occupied residential; commercial, industrial, and multifamily rental).
The beauty of these studies lies not just in their sophistication but in the simple ranking, from #1 to #53, of all jurisdictions from those with the highest effective tax rate to the lowest effective tax rate. The simple beauty of these rankings, which tends to attract the most attention among taxpayers and policymakers, masks the danger of seeing only which locality has the higher or lower effective tax rate.
And this is where the most recent national study, released in June 2016, takes the analysis to a new and far more important level. This study asks not just how effective property tax rates vary across the country; it begins to probe the more fundamental question of why there is such variance. It identifies four explanatory variables: (i) the reliance of the local government on property taxes as general revenues: (ii) the size of the denominator of property values themselves; (iii) the aggregate level of local government spending, and (iv) the “classification ratio” which is the ratio of taxation of commercial and rental properties to owner occupied residences. These variables begin to explain why Detroit, Michigan, has a very high tax rate (low property values) and Boston, Massachusetts, has a very low rate (higher taxes on commercial properties). It also helps explain why Jackson, Mississippi, has a much higher tax rate than Seattle, Washington, but a much lower tax bill.
The most recent edition of the national comparative study is by far the most informative and useful of all of the annual reports. While it still contains the seductive national rankings, it is hard not to miss the deeper evaluation that presents the context for each of the comparative effective tax rates.
As strong as this new study is, it only invites the question that has never been addressed in any of these studies: What percent of the property taxes is actually collected?
If a local government collects 90% of its gross property tax receivables within a 12 or 24 month period following the due date it will necessarily experience greater pressure on higher millage rates than if it were able to collect 98% of its receivables within that same period of time. Uncollected or uncollectable receivables are a necessary element of all revenue and budget forecasts. If comparative analyses are to be done in the field of property taxes, the effective rate of collection of the tax bills that are issued has to be a key variable for taxpayers and policymakers alike.
This omission is magnified by the simple fact that when 2% or 10% of the tax digest remains uncollected, the properties subject to the unpaid taxes are most commonly the inventory that is vacant, abandoned, and substandard. This narrow slice of real property inventory is also the inventory that tends to impose the greatest external costs on surrounding property values, on public police and fire services, on housing and building code enforcement.
The effective property tax rate of each local government is directly influenced by the amount of uncollected property taxes and the conditions of the property for which the taxes remain unpaid. There are hundreds of different systems being used for property tax collections, most of which fall short of the goal of being efficient, effective and equitable systems.
The Lincoln Institute and the Minnesota Center for Fiscal Excellence have now gone where the brave dare not go. As they lead us into the dark recesses of this thorny ticket let us hope that they pursue the question of the uncollected property taxes and the burdens placed on responsible taxpayers when others refuse to pay the taxes that are due and leave their properties vacant and abandoned.
Subscribe to join 14,000 community development leaders getting the latest resources from top experts on vacant property revitalization.
